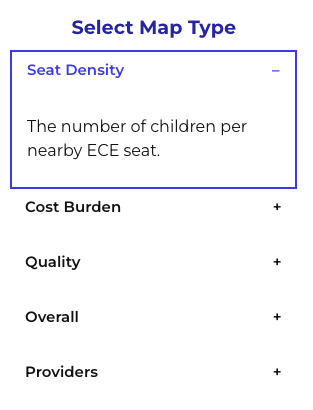
Map Type and Index Selection
- Left Sidebar: Choose the map type or index you want to explore. Use the dropdown menus or buttons to select from various options.
Geographic Level Selection
- Top Center Buttons: Decide whether you want to view data at the census tract level or the housing lot level. Click the respective button to switch between these two views.

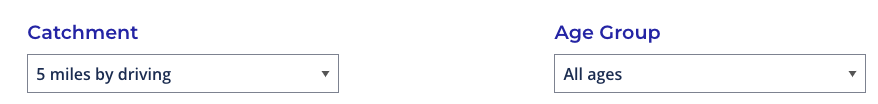
Catchment Area and Age Group Selection
- Right Top Bar: Select the catchment area and the age group you are interested in. Use the dropdown menus to refine your selection.
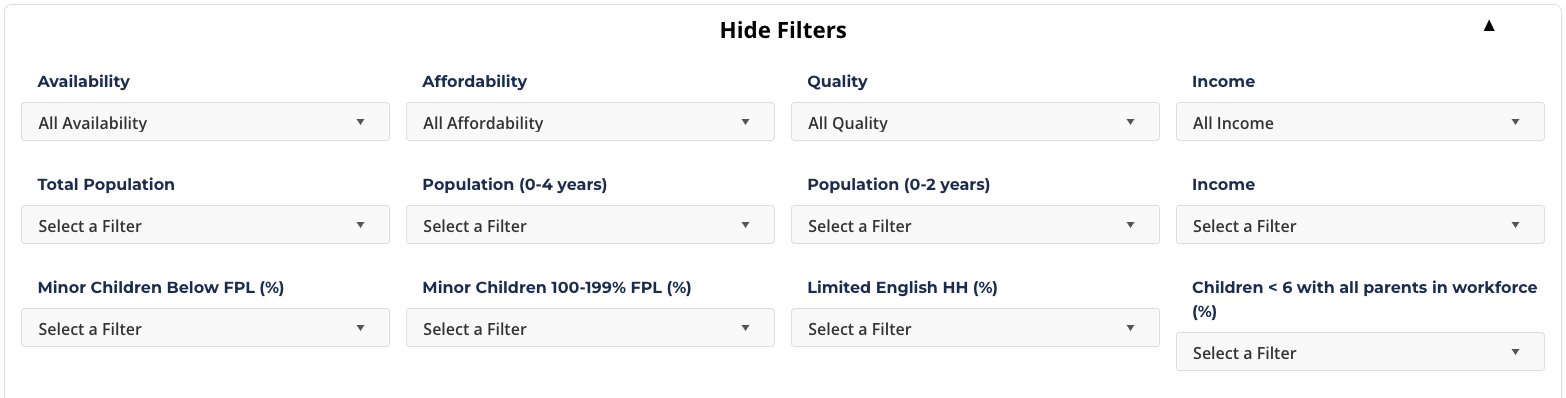
Cross-Index and Demographic Filters
- Top of Map Window: If desired, set the cross-index and demographic filters to narrow down your data. These filters allow you to customize the data displayed on the map according to specific criteria. Use this function to display an access index map that only includes selected census tracts. Cross index filtering lets you show combinations of access indexes, e.g., show seat density only for tracts with high ECE quality. Demographic filtering shows an access index only for communities with certain population characteristics, e.g., display seat density only for low-income tracts.
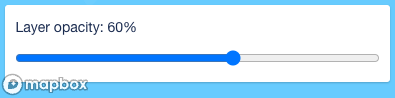
Layer Opacity Adjustment
- Bottom Left of Map Window: Adjust the opacity of the map layers to your preference. Use the slider to increase or decrease the transparency of the layers for better visualization.